|
Cavity measurement thus provides valuable information in a variety of situations,
for both electrical and non-electrical applications. A few specific areas include:
-
RF characterization of plastics/ceramics for wireless applications.
-
Characterization of insulation losses for cable-TV/LAN applications.
-
Material diagnostics for specialty low-loss ceramics.
-
Characterization of oil-exploration fluids.
-
Characterization of adhesive, cosmetic, and pharmaceutical materials.
MSI provides cavity measurement from 1 GHz to 10 GHz in accordance with standard
ASTM methods [D2520, etc.]. The dielectric constant - or real permittivity - is measured anywhere from
2-4 for plastics to around 10-20 for ceramics, with 2-3 digit resolution. The dielectric loss
- or imaginary permittivity - is resolved down to 0.01 or less.
Also the loss tangent - the ratio of the real to imaginary
permittivity - is resolved to the order of 0.001 or less. The measurement is non-contact, with results depending only
on the change in resonance frequency and width and sample volume.
In addition we also provide custom microwave cavity design, fabrication and sales.
We provide controlling software for automating external signal generators and power meters and storing/analyzing
datafiles offline. Some areas discussed below:
-
Microwave Cavity Background
-
Microwave Cavity Setup
-
Microwave Cavity Sample Requirements
-
Microwave Cavity Examples
-
Available Cavity Frequencies
-
Technical references
1. Microwave Cavity Background
The principle of cavity measurement is straightforward. A conducting metal cavity is
constructed, with inner dimensions producing a standing-wave
resonance at the frequency of interest. The cavity is connected to
an external signal generator and power meter through launching ports
located on the side or top/bottom surfaces of the cavity. The signal
generator is swept across a range of frequencies, with the power
meter recording the detected power as a function of frequency. The
cavity is first measured empty, recording the resonance frequency
and width, and then measured again with the sample material stood
vertically at its center. The real permittivity is then calculated
from the change in resonance frequency, with and without the sample,
and the imaginary loss calculated from the change in resonance
width, with and without the sample. Each sample is placed vertically
at the center of the cavity, spanning the full cavity height, thus feeling the maximum electric field.
The relations for permittivity and loss are found in the literature [1-2]. The real permittivity ε' is calculated from:
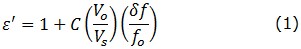
where (δf/f) is the ratio of the change in resonant frequency to the resonant frequency fo,
and (Vo/Vc) the ratio of the empty cavity volume to the sample volume. The constant C is a geometric factor,
which is 0.5 for rectangular cavities and 0.539 for circular cavities, with the latter arising from
Bessel function analysis. Similarly, the imaginary loss ε'' is calculated from:
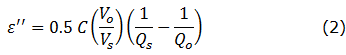
where Qs and Qo are the Q-factors for the sample-loaded cavity and empty cavity, respectively.
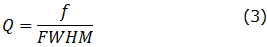
Each Q-factor is defined as the ratio of the resonant frequency to the Full-Width-at-Half-Maximum for that resonance:
Cavities can be fabricated with either
rectangular or circular geometry. MSI generally uses circular
geometry, since the latter has better performance and
with lower machining costs. By machining circular cavities from a single
copper block, precision joining of sidewalls is eliminated, where imperfect
sidewall contact can degrade cavity Q.
In all cavities the resonance frequency is inversely proportional to the cavity size.
Thus larger cavities produce a lower frequency resonance while smaller cavities produce a higher
frequency resonance. For circular cavities, the frequency varies with radius according to:
[3]
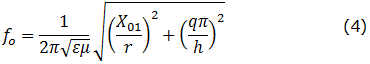
where X01 is a Bessel-function zero, r the cavity radius, h cavity height, ε
and μ the permittivity and permeability of free space [3,4]. For the TM-010 mode in circular
cavities, X01=2.405 and q=0, and the equation predicts
all the resonant frequencies below.
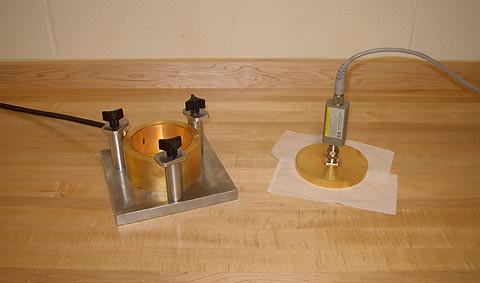
2. Microwave Cavity Setup
Our model 9450C circular cavity is shown
below. The cavity is 93.6 mm inside diameter and 50 mm high, and has
a resonance frequency of 2453 MHz, as calculated above. This
corresponds to the international frequency for 802.11 wireless
internet, as well as commercial microwave heating. The cavity is made
from McMaster alloy 101 oxygen-free copper and has a 1 um coating of
durable gold to prevent surface tarnish. The cavity has a removable
lid for placing and removing samples, and a clamping arrangement for
holding the lid securely. Signals are launched from a B-field loop
mounted on the cavity side, and detected with an E-field probe
mounted on the cavity lid, ensuring that only TM-010 modes are detected.
Robust N-type connectors connect to external signal generators and power
meters, which in turn are controlled by our automated software. The
cavity has a Q over 8000.
3. Microwave Cavity Sample Requirements
Test
samples can be in the form of rectangular solids or cylinders, with the
length matching the cavity height and the widths or diameter being in
the range of 2 to 10 mm, depending on the measurement frequency and
sample permittivity. The actual cross-sectional geometry does not
matter, since only the sample volume goes into the calculation. Samples are stood vertically
at the center of the cavity, so the sample length cannot exceed
the cavity height, even by 0.1 mm. At lower frequencies
(850-2450 MHz) the sample width/diameter should be in the range of 5 mm
for polymeric materials, and 3 mm for ceramic materials. At higher
frequencies (5000-6300 MHz) the sample width/diameter should be in the
range of 3 mm for polymeric materials, and 2 mm for ceramic materials.
Some other points:
-
If the appropriate sample width is uncertain, send several samples of the
smaller width and we will stack them together as needed.
-
For sheet materials, cut several strips with the appropriate width
and we will bind them together with a light thread to form the necessary volume.
-
If the samples are slightly irregular in shape, send the material
density and we will weigh on a microbalance and determine the volume
from the mass/density relation.
-
For liquid materials, send an appropriate volume we will fill a
small PTFE container and measure, using the empty cavity and PFTE container as
the empty-cavity reference.
4. Microwave Cavity Examples
2450 MHz Polymer Measurements
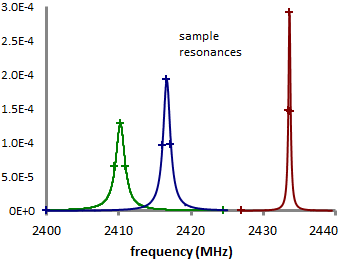
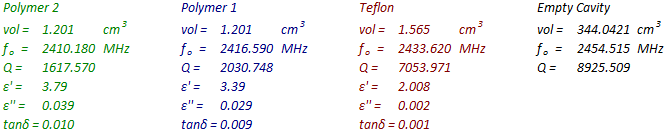
A microwave cavity measurement for a typical polymer material is show below. On the right is the empty-cavity resonance for the model 9450C.
As seen in the figure, the cavity has a resonance frequency of 2454.515 MHz
and a Q of 8925, where the peak frequency and full-width-at-half-maximum are
automatically marked and displayed in the legend. The empty cavity volume,
calculated from 2π·r2·h,
is 344.0 cm^3.
On the left is the cavity resonance for Teflon and
2 polymer samples, inserted individually and stood vertically at the center
of the cavity. The Teflon sample is round, 49.9 mm long by 6.32 mm in
diameter. The 2 polymer samples are rectangular, 50.0 mm long by 4.9 x
4.9 mm in width. The sample volumes are calculated from 2π·r2·h
or l·w·h, depending on sample geometry. The resonance frequency
for each sample is marked and displayed in the legend, as well as the cavity Q
and sample volume. As seen in the legend the permittivity
for Teflon is slightly above 2, consistent with the literature, with an extremely low loss tangent.
The permittivity for the 2 polymer samples is in the 3-4 range, typical of most polymers, with a
loss tangent varying between the 2 materials.
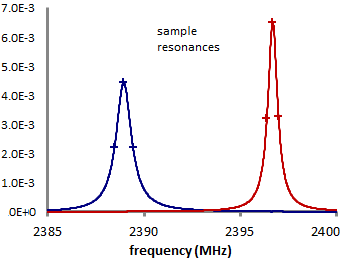
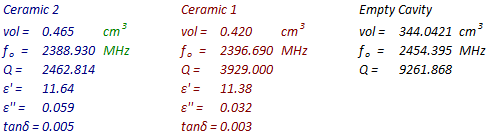
2450 MHz Ceramic Measurements For ceramic materials,
permittivities
are typically in the range of 9-12 with low loss. Below on the right is the empty cavity
resonance for the
2450 MHz cavity, essentially the same at 2454.395 MHz with a Q of 9261. Both test samples are now smaller,
to compensate for the higher permittivity. Ceramic 1 is 50.0 mm long by 3.0 x 2.8 mm in width, while ceramic
2 is 50.0 mm long by 3.0 x 3.1 mm in width. The resonance frequency for each sample is marked and displayed
in the legend, along with the cavity Q and sample volume. As seen in the legend, the permittivity both samples
is in the range 11-12, with extremely low loss. This is consistent with expected results for ceramic materials.
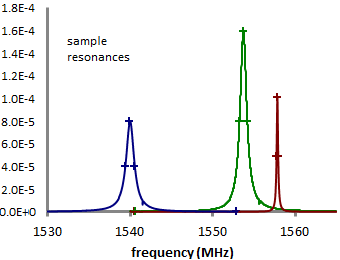
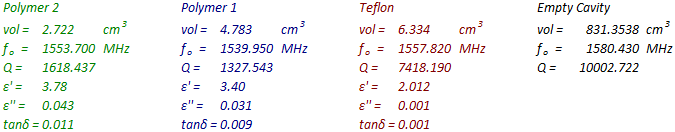
1575 MHz Polymer Measurements
Measurement can be done at other frequencies by varying the cavity
diameter. Below is a measurement at 1575 MHz, the international GPS
frequency, using the same polymer materials described earlier. The
cavity is now larger, 145.0 mm in diameter, as predicted by Equation 4.
Since this is a different cavity it provides an independent check of
2450 MHz results, and since the cavity frequency is lower we expect the real
permittivity to be
the same or slightly higher, in accordance with standard rules of dielectric
relaxation in solids. This can be verified by comparing the 1575 measurement
with the 2450 MHz polymer measurement described earlier, showing the real permittivity to be essentially the same.
Though the relative resonance shift for the two polymers is different,
since the relative
volumes are
different, the volume ratio Vo/Vs
compensates for this Equation 1, such that the permittivities
are the same.
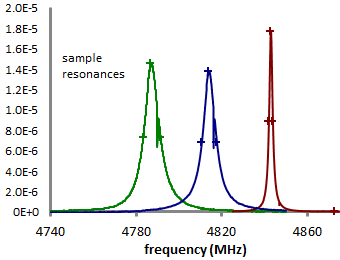
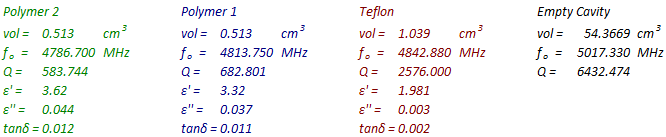
5000 MHz Polymer Measurements Similar measurements can be done
at 5000 MHz, the new WIFI-N frequency. Here cavity diameter is smaller, 45.8 mm diameter,
as predicted by Equation 4. The required sample size is also smaller, to keep the volume ratio
Vo/Vs reasonable and not overload the cavity. The measured permittivity is slightly
lower, comparing the 5000 MHz measurement with the 1575 and 2450 MHz measurements
described earlier. Again this is
consistent with standard rules of dielectric relaxation in solids.
5. Available Cavity Frequencies
MSI has a variety of microwave cavities for
different frequency ranges. Some of these are listed below
according to frequency, diameter, and cavity height. All
measurements are done with the sample stood vertically at the center
of the cavity, so it is important the sample length not exceed the
cavity height. The sample length should be as close as possible to the
cavity height, without going over.
In addition, recommended cross-sectional
dimensions are given for various frequencies and materials.
Samples can be either round or square, provided the cross-sectional
area is
comparable. For polymers, whose
permittivity is generally in the 3-4 range, we recommend a larger
diameter/width than ceramics, whose permittivity is generally in
the 9-12 range. Materials whose permittivity is expected to be
higher should have an even smaller diameter/width.
| Frequency |
Cavity diameter (length/width) |
Cavity height Sample length |
Sample diameter (polymer) |
Sample diameter (ceramic) |
Description |
Comment |
| 850 MHz |
270 mm |
50.0 mm |
5-10 mm |
5 mm |
Aluminum |
Cellular |
| 1575 MHz |
145 mm |
50.0 mm |
5 mm |
3 mm |
High-Q OF copper |
GPS |
| 2100 MHz |
101.6 x 101.6 mm |
25.4 mm |
3-5 mm |
2-3 mm |
High-Q gold-plated |
wireless |
| 2450 MHz |
93.6 mm |
50.0 mm |
3-5 mm |
2-3 mm |
High-Q OF copper |
WIFI |
| 4500 MHz |
50.8 mm |
50.8 |
3 mm |
2 mm |
High-Q gold-plated |
|
| 5000 MHz |
45.8 mm |
33.0 |
3 mm |
2 mm |
High-Q OF copper |
WIFI-N |
| 6300 MHz |
33.3 x 33.3 mm |
33.3 mm |
2-3 mm |
1.5- 2 mm |
High-Q gold-plated |
|
| 9000 MHz |
25.4 mm |
25.4 |
2 mm |
1.5 mm |
High-Q gold-plated |
|
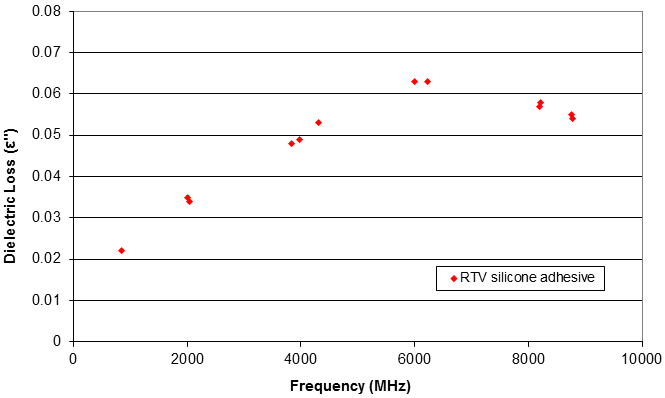
Combined Cavity Measurements
In most solid materials, the dielectric properties do not change
significantly at microwave frequencies. Thus measurement at select frequencies, such as
1575, 2450, and 5000 MHz, provide a full characterization over the relevant range. However if
desired, we can perform measurements at multiple frequencies and combine to provide a more
detailed dielectric spectrum. An example is show below for a low-loss RTV silicone adhesive. Here
results from 7 different cavities are combined to show a weak dielectric loss peak over the range
850 MHz to 9010 MHz.
6. Technical References
Additional information on Microwave Cavity Measurement can be found at:
-
A. W. Kraszewski, S.O. Nelson "Resonant Cavity Perturbation -
Some New Applications of an Old Measuring Technique", Journal of Microwave Power
and Electromagnetic Energy, Vol 31, page 178 (1996).
-
Anand Parkash, J.K. Vaid, and Abhai Mansingh, "Measurement
of Dielectric Parameters at Microwave Frequencies by Cavity Perturbation Technique",
IEEE Trans. Microwave Theory and Techniques, Vol. 27, No. 9, 791 (1979).
-
Samuel L. Liao, Microwave Devices and
Circuits, Prentice-Hall, New Jersey (1980).
-
ε = 8.85·10-12 F/m, μ = 4π·10-7(V·s)/(A·m).
.
Copyright © 2015 Material Sensing & Instrumentation, Inc.

|