-
A free-water component near 10 GHz representing chemically unreacted water which
decreases continuously during cure.
-
A medium-relaxation component around 100 MHz representing water attaching to
developing microstructure which increases during early cure.
-
A low-relaxation component around 1 MHz representing local ion migration in
developing microstructure which increases during early cure.
-
An ion-conductivity component below 1 MHz representing long-range ion drift
through developing structure which decreases continuously with cure.
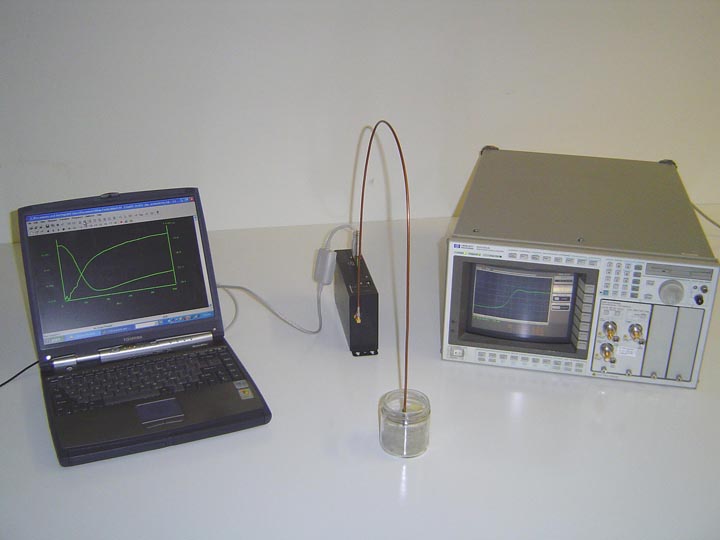
A unique aspect of the system is that the measurement is performed the time domain,
where sensor response can be separated from other effects by propagation delay. Data can be either transformed
to a microwave frequency spectrum for scientific-quality analysis, or interpreted directly in the time domain for
robust field-grade control. The same system is used in both cases and scaled-up or scaled down as appropriate.
Frequency-Domain Cure Monitoring
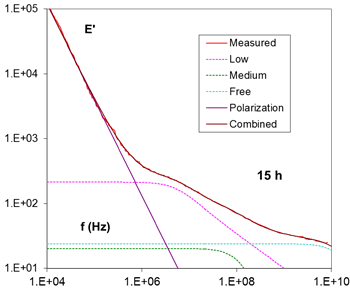
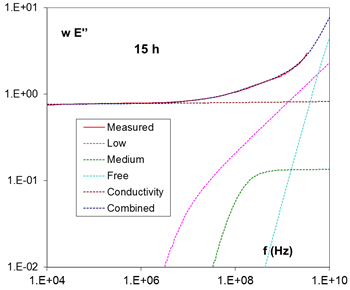
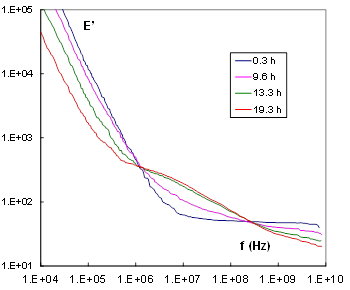
A typical TDR frequency spectrum for Portland Cement is shown below. Data is presented
as frequency-dependent permittivity, starting at 10 kHz on the left and ending at 10 GHz on the right for both
real and imaginary components. The signal is repeated several times during the cure process, starting at 8 minutes
with the red trace and ending at 20 hours with the brown trace. The material is a standard portland cement obtained
from the NIST Cement and Concrete Reference Laboratory (CCRL) and mixed in a water/cement ratio of 0.4.
 |
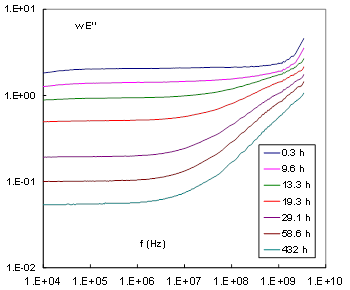 |
The TDR spectrum separates into 3 easily-identifiable features for both real and imaginary
permittivity. On the right is the free-water response, representing water in an unattached state which falls during
the period. In the middle is an intermediate-frequency response representing local ion migration and water attaching
to developing microstructure, which grows during the period. On the left is the ion conductivity, representing ions
moving through the microstructure which falls during the period.
Dielectric modeling reveals additional details [3]. Standard dielectric models including Debye
and Cole-Davidson are simultaneously fit to both real and imaginary permittivity using shared model parameters. The
intermediate- frequency feature separates into 2 components, with a 1 MHz component representing ion migration in
developing microstructure and 100 MHz component representing water attaching to developing microstructure. The low,
medium, and free-relaxation components can now be tracked continuously during the cure process.
The free- and bound-water response are only obtainable by high-frequency methods such as TDR.
The free-water falls with cure and represents water loss to hydration. The bound water rises with cure and represents
formation of early microstructure. We thus monitor loss of reacting and formation of developing microstructure simultaneously.
Time-Domain Cure Monitoring
A very simple application is to monitor the direct TDR transient from which the frequency spectra
are derived. Early portions of the pulse around 100 picoseconds represent 10 GHz behavior containing the free-water response,
while latter portions of the pulse around 50 nanoseconds represent 20 MHz behavior containing the bound-water response.
The two signals can thus be monitored as a function of cure time, producing simple stripchart-grade indicators of free- and
bound-water response. Typical results for CCRL Portland cement are shown below.
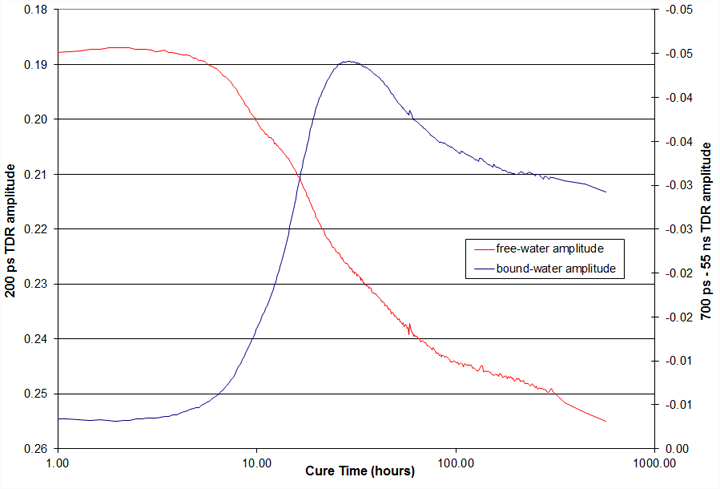
The figure shows the transient stable during the initial dormant period, and then showing a
loss of free-water and the growth of bound-water at around 10 hours. Then bound water reaches a peak around 20 hours,
and then begins to fall as water becomes more tightly-bound and the TDR frequency spectrum broadens. The free- and
bound-water signals continue to show a slow decrease to 500 hours.
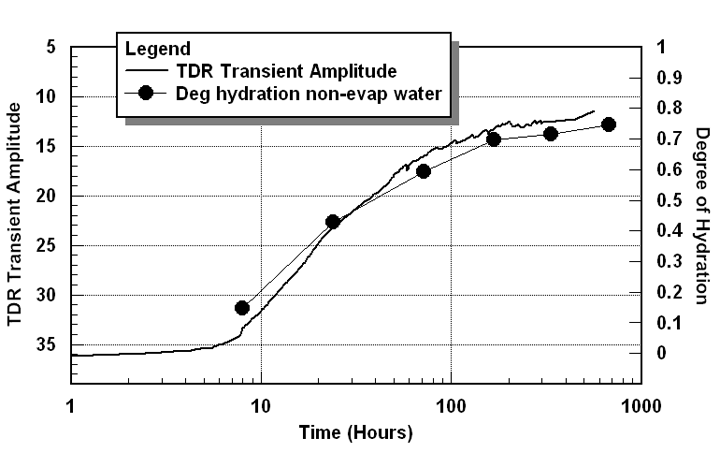
Comparison with Hydration Measurement
The free-water transient signal can be directly compared with the water loss of hydration.
The amplitude represents the free-water permittivity where only unreacted water is active, so the measured signal
represents the volume fraction of unreacted water in the cement paste, which is the inverse of the degree of hydration.
For CCRL cement the degree of hydration is known from a measurement of non-evaporable water content, and is compared
with the direct-transient amplitude below.
Sensitivity to Formulation Change
The TDR free- and bound-water signals can provide an extremely useful indicator of cure development,
and in some cases anomalous cure development. Some specific examples involving variation in formulation are described below
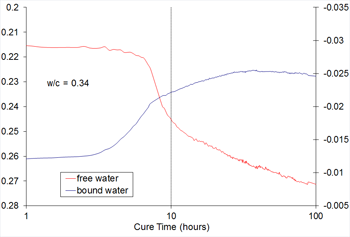
Variation in water/cement ratio TDR can be used to examine variations in
water/cement ratio. The figure below shows the free- and bound-water signals for TriCalcium Silicate, the primary constituent
in Portland Cement. On the left is a water/cement ratio of 0.34 while on the right is a water/cement ratio of 0.50. The figure
on the left has a lower free-water signal at both beginning and end of cure, and falls more rapidly around 10 hours due to more
rapid depletion of available free water. The 0.34 sample also shows a lower bound-water signal at long time cures.
 |
 |
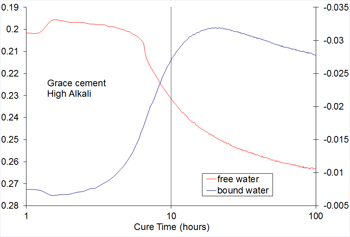
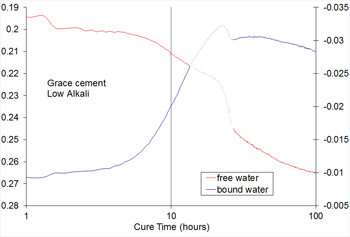
Variation in Cement Reactivity TDR also shows the difference between a high-
and low-alkali cement having a different reactivity. The figure below shows the TDR signals changing well in advance of 10 hours
for the high-alkali cement, but only beginning to change at 10 hours for the low-alkali cement. The actual reactivity, as measured
by maximum temperature rise, is 8.2 hours for high-alkali cement and 10.5 hours for the low-alkali cement. TDR is thus measuring
the change in free- and bound-water response accompanying this difference.
 |
 |
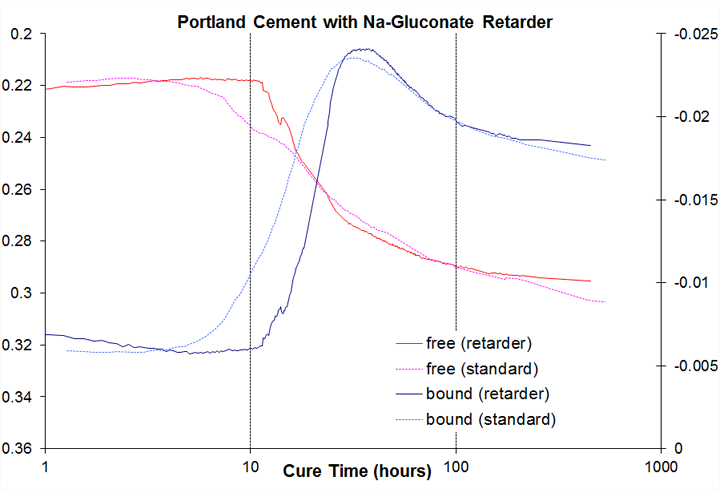
Addition of Retarders
TDR shows the effect of chemical retarders
on cure evolution. Two samples of portland cement are shown below, both mixed in a water/cement ratio of 0.4
with one containing Na-Gluconate retarder. The sample containing 250 ppm retarder shows an obvious delay from
the sample without retarder, and it is clear that TDR detects this delay and the subsequent variations in free-
and bound-water activity. The Na-Gluconate retarder has no direct effect on TDR signal because of its low concentration.
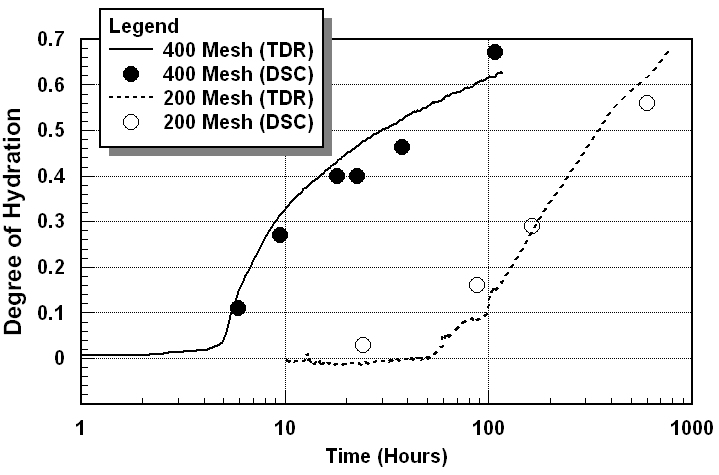
Variation in Particle Size TDR also shows effect of particle size
distribution on hydration rate. The figure below shows the free-water signals for two TriCalcium Silicate samples with
a varying particle size distribution and reaction rate. The small particle size (400 mesh) begins to decrease at 6-8 hours
while the large-particle size (200 mesh) only begins decreases after several days. Both signal decreases are compared
with Differential Scanning Calorimetry (DSC) as shown below
Features, Advantages, and Benefits
The above describes some specific examples of TDR Cure Monitoring System
and its application. Some general features, advantages, and benefits of the system are listed below
| Microwave frequency sensing. |
Monitors free- and bound-water molecular dynamics. |
Provides more information on water loss to hydration and formation
of hydration products than lower cost solutions. |
| Pulsed sensor interrogation. |
Isolates sensor response by propagation delay. |
Simplifies microwave calibration procedure. Easy to install and use. |
| Coaxial pin sensor. |
Matches impedance over wide range of frequency and cure state. |
Rugged and low-cost. Provides ability to analyze molecular dynamics over
wide range of frequency and cure state. |
| Fourier transform analysis. |
Provides free- and bound-water molecular rotation spectrum. |
Provides analysis of free- and bound-water molecular dynamics at
level research laboratories expect. |
| Direct transient analysis. |
Provides stripchart-grade indicators of free- and bound-water spectrum. |
Provides information on water loss and formation of hydration
products quickly and in a simplified manner. |
| Portable electronics package. |
Provides small portable unit with LCD or PC display. |
Portable and robust electronics suitable for field use.
Monitors multiple sensors simultaneously. |
National Science Foundation
Our work is being carried out jointly with the Microwave Materials Lab at Elizabethtown College,
Elizabethtown PA. A recent NSF award to the microwave lab is as follows:
Award #0700699 - 1 May 2007
CMMI Division of Civil, Mechanical, and Manufacturing Innovation
ENG Directorate for Engineering
Monitoring of Hydration in Cement Systems by
Broadband Time-Domain-Reflectometry Dielectric Spectroscopy
Abstract
Prior work in our laboratory demonstrated a continuous monitoring of the dielectric
relaxation spectrum in hydrating portland cement over the frequency range 10 kHz to 8 GHz from initial
mixing to several weeks cure. Measurements were made using broadband Time-Domain-Reflectometry Dielectric
Spectroscopy with a 35 ps stimulus and an embedded capacitance sensor. Three fundamental signals were identified,
corresponding to unreacted free water, bound-water attaching to developing microstructure, and grain polarization.
The three signal components were fit to appropriate molecular models as a function of cure time and monitored
throughout the process. The result is 1) a free-water relaxation which monitors the disappearance of water into
hydration and thus follows percent hydration, and 2) a bound-water relaxation which monitors water attaching to
developing microstructure and thus monitors formation of this microstructure, and 3) a grain-polarization relaxation
which monitors development of this microstructure.
The proposed research will now expand this investigation to rigorously compare signal
changes occurring in each component with chemical and material changes through a combination of analytical
measurement, chemical variation, and experimental investigation. Measurements may include, but are not limited to:
Differential Scanning Calorimetry (DSC), Thermogravimetric Analysis (TGA), Thermoporometry, Quasi-Elastic Neutron
Scattering (QENS), optical microscopy, and standard mechanical compressive-strength testing. Specific tasks include
1) extending measurement resolution to near 10 GHz to better resolve individual free- and bound-water components,
2) correlating the disappearance of free water near 10 GHz with the increase in hydration as determined by DSC and
Thermogravimetric analysis, 3) correlating the increase in bound water near 100 MHz with the formation of reaction
products as determined by QENS, microscopy, and other methods, 4) Estimating the free-water loss to evaporation by
instrumenting a large test cylinder with sensors at varying depths and determining moisture gradients, 5) Examining
appropriate variations in chemistry and their effect on signal evolution, and 6) Exploring the thermodynamics of the
relaxation processes with respect to pore size by freezing the material during hydration.
The proposed activity will expand our understanding of the chemical state of water in
hydrating cement and provide a foundation for using TDR spectroscopy as a powerful tool for investigating hydration
in a variety of cementitious materials. Results will have applications in a variety of inorganic/organic systems
including the study of structure and dynamics in aqueous and biological systems including DNA, proteins, and
micelles. The activity will impact on our collaboration with industry in process-monitoring and control and our
involvement with students through undergraduate research at Elizabethtown College. It could lead to long-term
collaboration with our biology department on potential biological applications and development of a business
project for cement sensors through our business department.
Techical References
Additional information on TDR Concrete Cure Monitoring can be found at:
-
N. E. Hager III and R. C. Domszy, "Time Domain Reflectometry Complex Permittivity Measurement
in Hydrating Cement Systems for Determining Chemical State of Water", 2nd Intl Symposium on Soil Water
Measurement using Capacitance, Impedance, and Time Domain Transmission", USDA/ARS Beltsville MD,
(2007) msi_soilwater_paltin_2007.pdf
-
N. E. Hager III and R. C. Domszy, "Monitoring of Cement Hydration Processes in Cement
Materials by Broadband TDR Dielectric Spectroscopy", American Ceramic Society MS&T Detroit 200728 (2007).
download pdf msi_cement_ACerS_2007.pdf
-
N. E. Hager III and R. C. Domszy, "Monitoring of Cement Hydration by Broadband TDR
Dielectric Spectroscopy", J. Appl. Phys. 96, 5117-5128 (2004). download pdf*
msi_cement_jap_2004.pdf
-
N.E. Hager III, R.C. Domszy, U. S. Patent 6,819,121 (2004).
| |
 |
 |
*Copyright 2004 American Institute of Physics. This article may be
downloaded for personal use only. Any other use requires prior permission of the author and the
American Institute of Physics. The following article appeared in Journal of Applied Physics and may be
found at http://link.aip.org/link/?jap/96/5117
.
Copyright © 2015 Material Sensing & Instrumentation, Inc.

|